
Finally Know What You've Actually Done
Task lists show what's left. Insights show what you've accomplished. Heatmaps, streaks, and charts that make your progress visible.
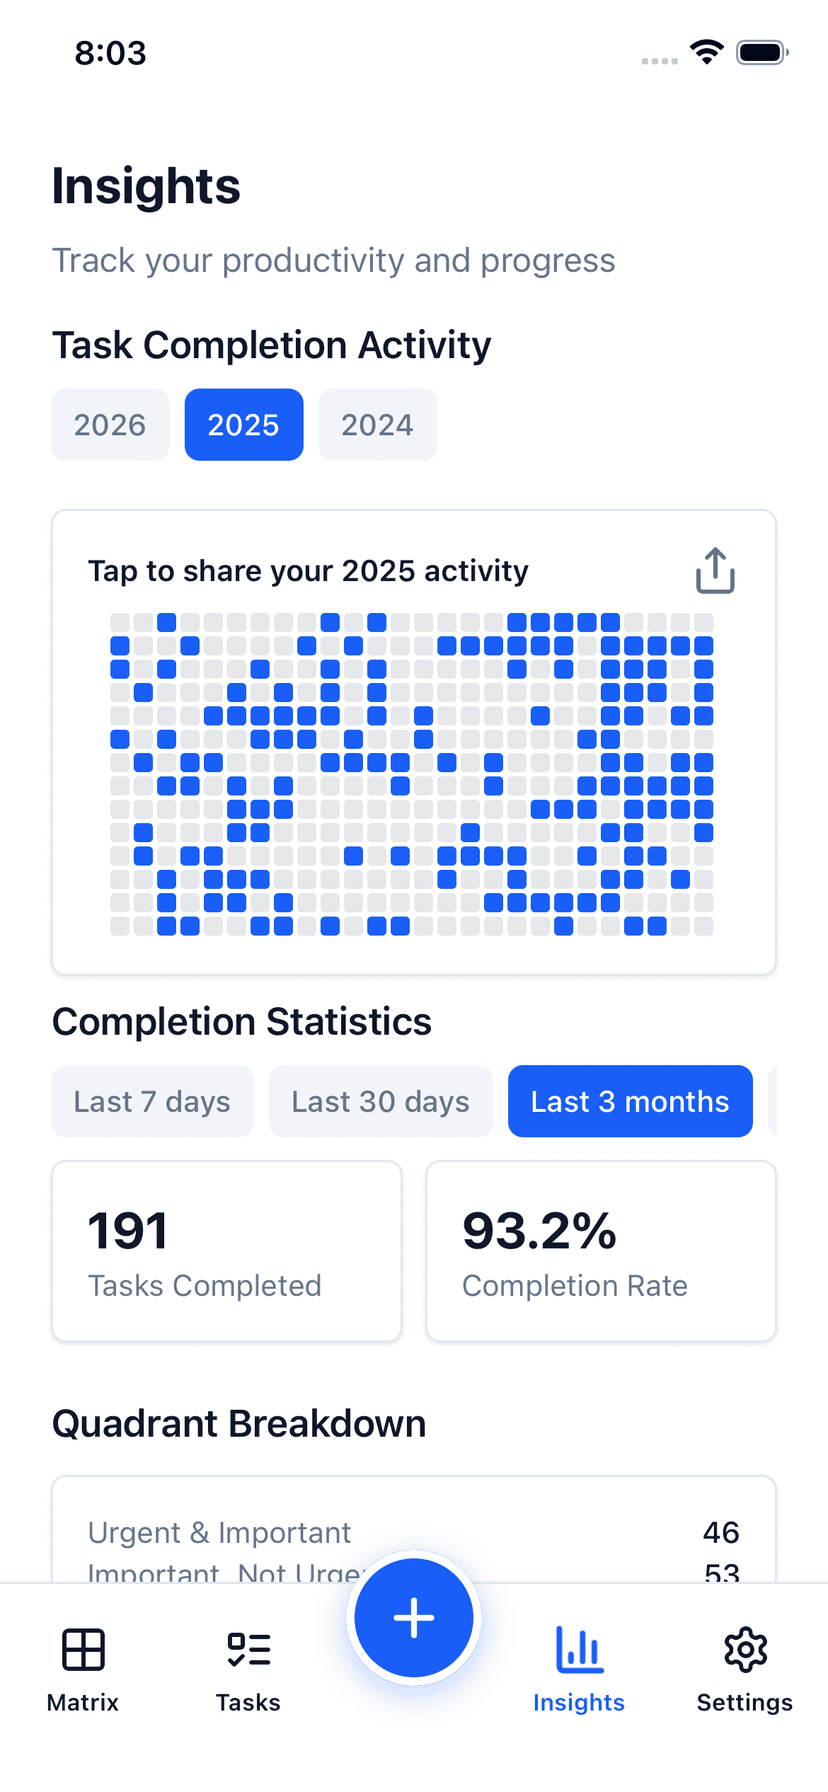
GitHub-Style Activity Heatmap
A full-year calendar view showing your daily task completion density. Color intensity increases with activity level.
Your productivity, visualized. See patterns you'd never notice from a list.
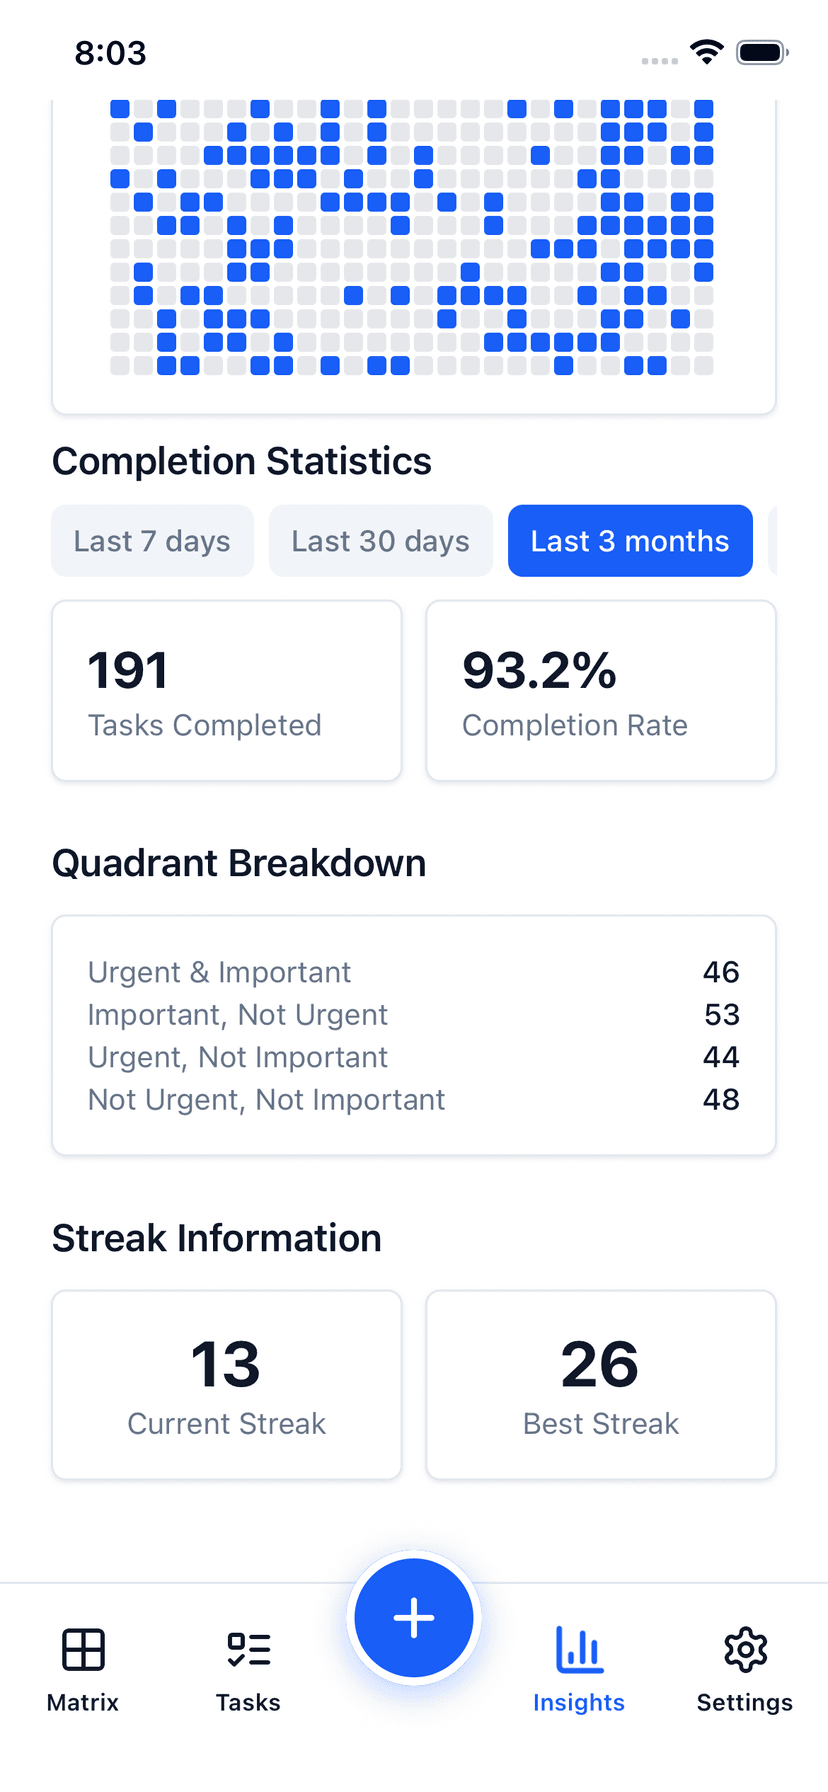
Streaks That Keep You Consistent
Current streak, best streak, consecutive completion days. Don't break the chain.
The oldest motivation trick in the book, built right in. Watch your streak counter grow and feel the pull to keep it going.
Charts and Breakdowns
- Daily, weekly, and monthly trend charts — tasks created vs. completed
- Quadrant breakdown: which quadrants get the most attention?
- Priority distribution across Low, Medium, High, and Critical
- Time ranges: 7 days, 30 days, 3 months, year, all time
See your progress over time
Build consistency with streaks
Identify quadrant imbalances
Exportable data
Stop Organizing. Start Doing.
Brain dump, AI prioritization, and daily focus, wherever you work.
Trial unlocks unlimited AI features — cloud sync requires an active Pro subscription.